
Newport Beach Housing Market Report: Q3 2026
Megan Varga | October 11, 2026
Megan Varga | October 11, 2026
Home sales in Newport Beach, Corona del Mar, and Newport Coast from July through September 2026.
Updated October 2026.
If you own a home in Newport Beach or are thinking about buying one, you probably want to know whether prices are still going up and how fast homes are selling. This report answers both questions for the third quarter of 2026, which is July through September. It covers Newport Beach, Corona del Mar, and Newport Coast, and compares each one with the same months last year and with Orange County as a whole. The figures come from the regional MLS. We update this page every quarter.
Newport Beach home prices were higher in the third quarter of 2026 than a year earlier. The median sale price was $3.65 million, up 11%. Fewer homes were for sale, and homes took longer to sell. In September, after mortgage rates rose to nearly 7%, about half as many homes went under contract as in August.
Prices are up from a year ago in all three parts of the city. The number of homes for sale is down. In September, the number of new contracts fell sharply.
The MLS reports Newport Beach, Corona del Mar, and Newport Coast as three separate areas. In this report, "Newport Beach" means the rest of the city outside those two. That includes the harbor and island neighborhoods, the Peninsula, the Port Streets, and the gated communities around Fashion Island. Our guide to the best neighborhoods in Newport Beach explains how these areas fit together.
Here is how the median sale price changed from the third quarter of 2025 to the third quarter of 2026 (CRMLS via InfoSparks, checked October 2026):
Newport Beach: $3.65 million, up 11%
Newport Coast: $6.24 million, up 18%
Corona del Mar: $4.56 million, up 23%
Orange County: $1.22 million, up 3%
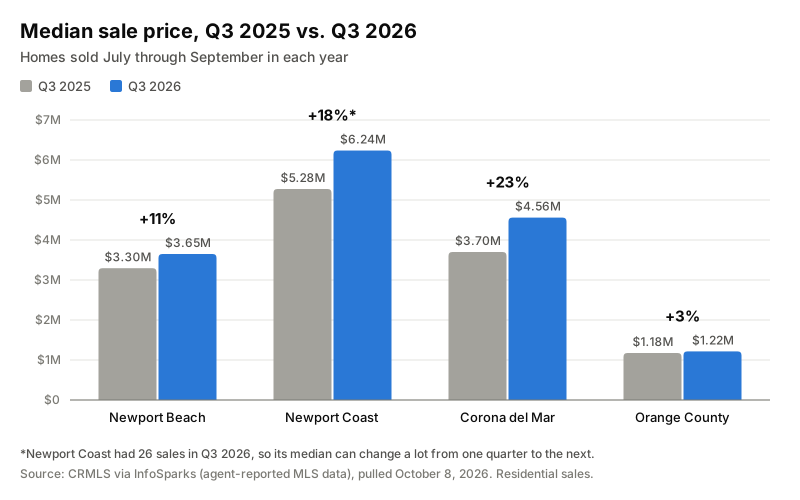
These gains are larger than the gains in price per square foot. In Newport Beach, price per square foot rose 6%. In Corona del Mar, it rose 5%. So part of the higher median comes from which homes sold this summer. It suggests more large or high-end homes sold than a year ago. Values did go up, but by less than the median suggests.
The Newport Coast figures need a note. Only 26 homes sold there in the quarter. With that few sales, one or two large sales can move the median a lot. Newport Coast's three-month median was $10.7 million in July and $6.24 million by September. Our Newport Coast community guide explains how prices vary between its gated communities.
The table shows each measure for the third quarter of 2026. The figure in parentheses is the change from the third quarter of 2025, or last year's figure where a percentage would be confusing.
Source: CRMLS via InfoSparks, agent-reported MLS data, checked October 8, 2026. Residential sales. Medians and averages cover July through September.
Megan has a Master's degree in Real Estate Development from USC. The Group checks every median against price per square foot and the number of sales before drawing a conclusion from it. The mix of homes that sold in a quarter can change the median more than values change, so a report that only gives the median can mislead.
There were 13% fewer homes for sale in Newport Beach than a year earlier, and 27% fewer in Corona del Mar. New listings were down about 10% in both areas.
Months of supply is the number of months it would take to sell every home on the market at the current pace of sales. It was 4.8 months in Newport Beach, down from 5.6. In Corona del Mar it was 4.0 months, down from 5.9. Newport Coast had 6.1 months, so buyers there have more homes to choose from. All three are higher than Orange County's 3.5 months. Higher-priced areas usually have more months of supply.
Homes in Newport Beach sold in a median of 36 days, up from 23 a year earlier. Sellers received 95.3% of their original asking price, down from 96.7%. On a $3.65 million home, that difference is about $50,000.
Corona del Mar was different. Homes there sold in 33 days, and sellers received 97.2% of their original price, up from 93.9%. Fewer listings and more sales made it the strongest of the three areas this quarter.
In August, 102 homes went under contract across Newport Beach, Corona del Mar, and Newport Coast. In September, 52 did. A year earlier, in September 2025, the number was 86. Orange County as a whole had a similar drop, from 1,750 contracts in August to 991 in September.
The 30-year fixed mortgage rate averaged 6.97% in mid-September, the highest since February 2025 (Bankrate, September 16, 2026). The drop in contracts came in the same month.
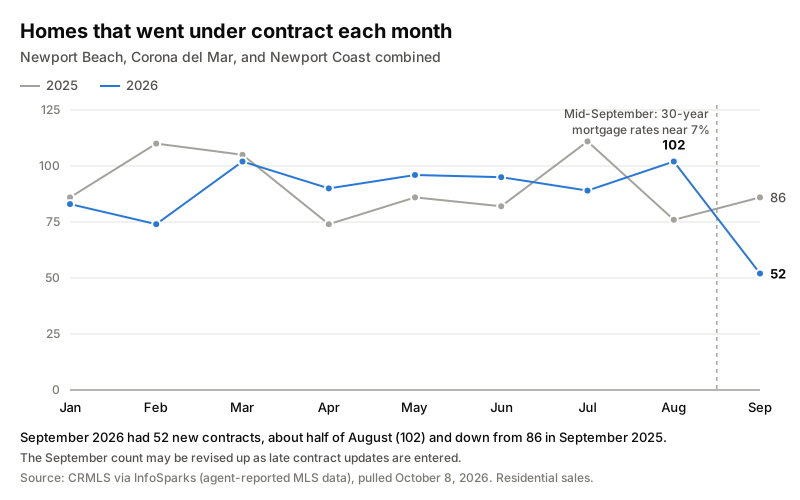
This is one month of data. Some September contracts may not have been entered in the MLS yet when we pulled the data, so the final count could be higher. Homes that go under contract usually close 30 to 45 days later. If the slower pace continues, fewer homes will close in October and November than in the summer.
Prices held through September. Buyers became slower to commit after rates went up. The Group expects the fourth quarter to show fewer sales, and we will know more about prices when the January report comes out.
If you are selling this fall, set your price from recent sales and from the homes you are competing with now. Prices from the spring are out of date. In Newport Beach, homes took longer to sell this summer and sold further below their original asking price. A price that is too high at the start usually leads to a price cut later. Our article on how Newport Beach home valuations work explains what sets the price of a home here.
If you are buying, there are fewer homes for sale than a year ago. There are also fewer buyers making offers. Sellers whose homes have been on the market since the summer may be more willing to negotiate. If you need a loan, get a current rate quote before you set your budget, because rates changed quickly in September. If you are paying cash or making a large down payment, a slower month may give you more room to negotiate.
If you own a home and are not planning to move, you do not need to do anything because of these numbers. Values in all three areas are higher than they were a year ago.
In the third quarter of 2026, the median sale price was $3.65 million in Newport Beach, $4.56 million in Corona del Mar, and $6.24 million in Newport Coast. The Orange County median was $1.22 million (CRMLS via InfoSparks, checked October 2026).
Not as of the third quarter of 2026. Median prices and price per square foot were higher than a year earlier in all three parts of the city. The drop in new contracts in September is the first sign of a slower market. The fourth-quarter report will show whether prices follow.
A common rule of thumb is that under four months of supply favors sellers, and over six months favors buyers. By that measure, Newport Beach (4.8 months) was balanced in the third quarter of 2026. Corona del Mar (4.0 months) leaned toward sellers. Newport Coast (6.1 months) leaned toward buyers.
Every quarter. The figures come from the California Regional Multiple Listing Service (CRMLS), through its InfoSparks reporting tool. The next update will cover October through December 2026 and will be posted in January 2027.
The third quarter of 2026 was steady for Newport Beach prices. There were fewer homes for sale, and homes in most of the city took longer to sell. In September, new contracts dropped sharply after mortgage rates rose. The fourth-quarter report will show whether that continues.
Citywide figures do not tell you what one home is worth. A bayfront home on Balboa Island and a home in Eastbluff are both in the "Newport Beach" column, and their markets are different. If you are thinking about selling, start with a Newport Beach home valuation based on the sales closest to your home. If you are buying and want to know how these numbers apply to the neighborhoods you are considering, contact the Megan Varga Group.
Megan Varga Group's excellent reputation, integrity and loyal client base ensures you are working with professionals you can trust. Contact us to put our extensive education, wealth of experience, and proven track record to work for you.
Megan Varga Group is affiliated with Compass, a licensed real estate broker in California, and abides by Equal Housing Opportunity laws. All material presented herein is intended for informational purposes only. Information is compiled from sources deemed reliable but is subject to errors, omissions, changes in price, condition, sale, or withdrawal without notice. All measurements and square footages are approximate. This is not intended to solicit property already listed. Nothing herein shall be construed as legal, accounting or other professional advice outside the realm of real estate brokerage.
Megan Varga Group’s excellent reputation, integrity and loyal client base ensures you are working with professionals you can trust. Let Megan Varga Group's extensive education, wealth of experience, and proven track go to work for you.
CONTACT US